Maxwell · Electromagnetic waves
Maxwell cavity resonances
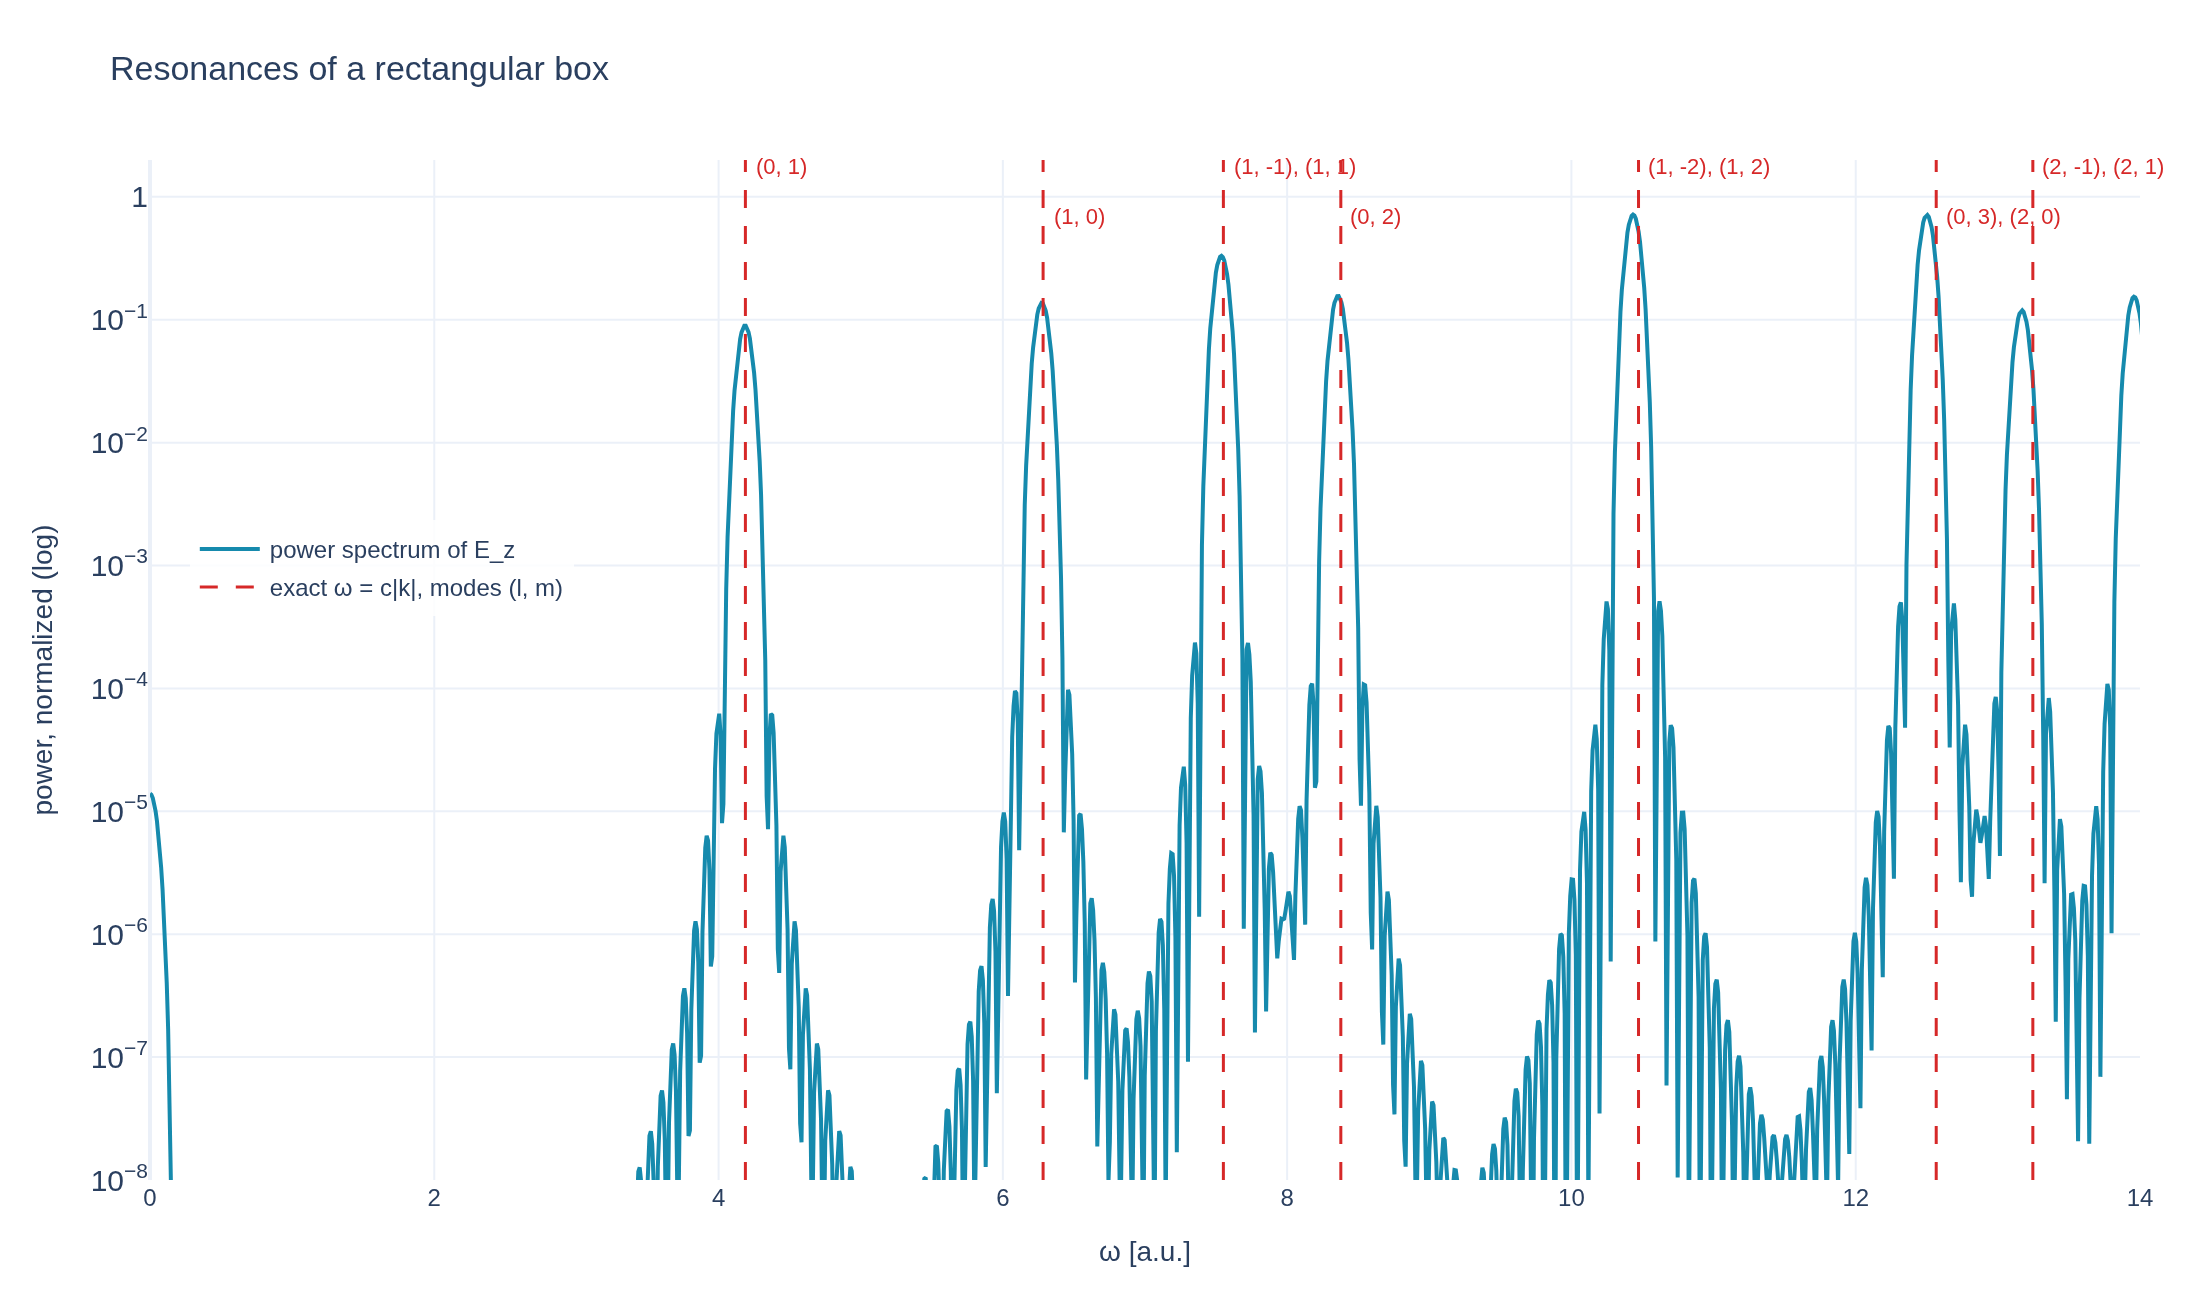
Noise in the electric field excites every electromagnetic mode of a rectangular periodic box. The power spectrum of the field over time has one peak per resonance, at the exact frequencies ω = c |k| of the box.
Loading interactive figure…
Loading interactive figure…
Physical problem
The resonances of a box
PDEs solved by model:
Ampère's law (no current):
Faraday's law:
Simulation geometry
Domain used in this run
The actual Cuboid geometry reconstructed from this run's metadata. Switch between the 3D view and physical-coordinate slices.
Domain
Cuboid
Mapping
Loading Cuboid…
Parameters
| Parameter | Value | Description |
|---|---|---|
| Loading parameters… | ||
Performance
Profiling
Struphy's built-in scope-profiler instruments every propagator, pusher and solver call — these are the real per-call timings from the run above.
Durations
Gantt (rank 0)
Region statistics
| Region | Count | Avg (s) | Min (s) | Max (s) | Total (s) |
|---|
Complete source
Simulation script
Requires Struphy with compiled kernels and Plotly. Run struphy compile once, then execute python maxwell-cavity-resonances.py.
"""Resonant frequencies of a rectangular box, with Struphy's Maxwell model.

Electromagnetic waves in a periodic rectangular box Lx x Ly stand in modes with wavevectors
(2 pi l / Lx, 2 pi m / Ly), oscillating at the frequencies

    omega_lm = c sqrt((2 pi l / Lx)^2 + (2 pi m / Ly)^2).

Random noise in the out-of-plane electric field E_z excites every mode at once. The power spectrum of E_z over time,
averaged over the box, then has one peak per resonance, and each peak is compared with the exact frequency. Because
the box is not a square, the resonances that would coincide in a square box separate.

Requires Struphy 3.3 with compiled kernels (`struphy compile`).
"""

import numpy as np
import plotly.graph_objects as go

from struphy import DerhamOptions, EnvironmentOptions, Simulation, Time, domains, grids, perturbations
from struphy.models import Maxwell

lx, ly = 1.0, 1.5
time_opts = Time(dt=0.02, Tend=80.0)

model = Maxwell()
model.propagators.maxwell.options = model.propagators.maxwell.Options(algo="implicit")
# Noise in the out-of-plane E_z couples to B_x and B_y: the transverse-magnetic modes of the box.
model.em_fields.e_field.add_perturbation(perturbations.Noise(direction="e1e2", amp=0.1, comp=2, seed=123))

domain = domains.Cuboid(r1=lx, r2=ly, r3=1.0)
grid = grids.TensorProductGrid(num_elements=(16, 24, 1))
derham_opts = DerhamOptions(degree=(3, 3, 1))

sim = Simulation(
    model=model,
    name="Maxwell cavity resonances",
    description=(
        "Noise in the electric field excites every electromagnetic mode of a rectangular periodic box. The "
        "power spectrum of the field over time has one peak per resonance, at the exact frequencies "
        "ω = c |k| of the box."
    ),
    env=EnvironmentOptions(out_folders="struphy_gallery_runs", sim_folder="maxwell_cavity_resonances"),
    time_opts=time_opts,
    domain=domain,
    grid=grid,
    derham_opts=derham_opts,
)


def resonances(omega_max, count):
    """The `count` lowest distinct (l, m, omega) of the box; (l, m) and (-l, -m) are the same resonance."""
    modes = {}
    for l in range(0, 8):
        for m in range(-8, 8):
            if (l, m) == (0, 0) or (l == 0 and m < 0):
                continue
            omega = 2.0 * np.pi * np.hypot(l / lx, m / ly)
            if omega < omega_max:
                modes.setdefault(round(omega, 9), []).append((l, m))
    return [(omega, modes[omega]) for omega in sorted(modes)][:count]


if __name__ == "__main__":
    from _gallery import export_profiling, is_root, merge_metadata, save_extra_figure, save_figure

    output = sim.run(profiling_activated=True)
    output.pproc(physical=True)

    # E_z at every point of the box, (t, x, y), and its power spectrum over time averaged over the box.
    e_z = output.evaluate("em_fields/e_field_xyz").isel(component=2, e3=0)
    field = np.asarray(e_z.transpose("t", ...).values)
    field = field.reshape(field.shape[0], -1)
    times = np.asarray(e_z.t.values)
    dt = float(times[1] - times[0])
    window = np.hanning(len(times))[:, None]
    padded = 8 * len(times)  # zero padding, to read the peak positions off a finer frequency axis
    power = (np.abs(np.fft.rfft((field - field.mean(axis=0)) * window, n=padded, axis=0)) ** 2).mean(axis=1)
    omega = 2.0 * np.pi * np.fft.rfftfreq(padded, d=dt)
    power /= power.max()

    exact = resonances(omega_max=14.0, count=9)
    measured, errors = [], []
    for omega_exact, _ in exact:
        # The strongest point of the spectrum within 0.15 of the exact frequency (the resonances are at least 1.1 apart).
        window_mask = np.abs(omega - omega_exact) < 0.15
        peak = int(np.argmax(np.where(window_mask, power, -1.0)))
        # Parabola through the peak and its two neighbours, for a sub-bin position.
        y0, y1, y2 = np.log(power[peak - 1 : peak + 2] + 1e-300)
        shift = 0.5 * (y0 - y2) / (y0 - 2 * y1 + y2)
        found = float(omega[peak] + shift * (omega[1] - omega[0]))
        measured.append(found)
        errors.append(found / omega_exact - 1.0)
    if is_root():
        for (omega_exact, modes), found in zip(exact, measured):
            print(f"modes {modes}: omega = {found:.4f} (exact {omega_exact:.4f})")

    figure = go.Figure()
    figure.add_scatter(x=omega, y=power, mode="lines", name="power spectrum of E_z",
                       line={"color": "#168aad", "width": 2})
    for index, (omega_exact, modes) in enumerate(exact):
        # Annotation heights on a log axis are log10 of the value.
        label = ", ".join(f"({l}, {m})" for l, m in modes[:2])
        figure.add_vline(x=omega_exact, line={"color": "#d62828", "width": 1.5, "dash": "dash"})
        figure.add_annotation(x=omega_exact, y=0.25 if index % 2 == 0 else -0.15, yref="y", text=label, showarrow=False,
                              xanchor="left", xshift=3, font={"size": 11, "color": "#d62828"})
    figure.add_scatter(x=[None], y=[None], mode="lines", name="exact ω = c|k|, modes (l, m)",
                       line={"color": "#d62828", "width": 1.5, "dash": "dash"})
    figure.update_layout(
        title="Resonances of a rectangular box", template="plotly_white", autosize=True,
        xaxis_title="ω [a.u.]", yaxis_title="power, normalized (log)", yaxis_type="log",
        legend={"x": 0.02, "xanchor": "left", "y": 0.6, "bgcolor": "rgba(255,255,255,0.82)"},
        margin={"l": 75, "r": 30, "t": 80, "b": 60},
    )
    figure.update_xaxes(range=[0.0, 14.0])
    figure.update_yaxes(range=[-8, 0.3])
    save_figure(figure, "maxwell-cavity-resonances")

    error_figure = go.Figure(go.Scatter(
        x=[omega_exact for omega_exact, _ in exact], y=100.0 * np.asarray(errors), mode="markers+lines",
        marker={"color": "#d62828", "size": 10}, line={"color": "#d62828", "width": 1, "dash": "dot"},
        hovertemplate="ω = %{x:.3f}<br>error = %{y:.3f} %<extra></extra>",
    ))
    error_figure.update_layout(
        title="Error of the measured resonance frequencies", template="plotly_white", autosize=True,
        xaxis_title="exact ω [a.u.]", yaxis_title="(measured − exact) / exact [%]",
        margin={"l": 75, "r": 30, "t": 80, "b": 60},
    )
    figures = [
        save_extra_figure(
            error_figure, "maxwell-cavity-resonances", "frequency-error",
            alt="Relative error of the measured resonance frequencies of a Maxwell box",
            caption=(
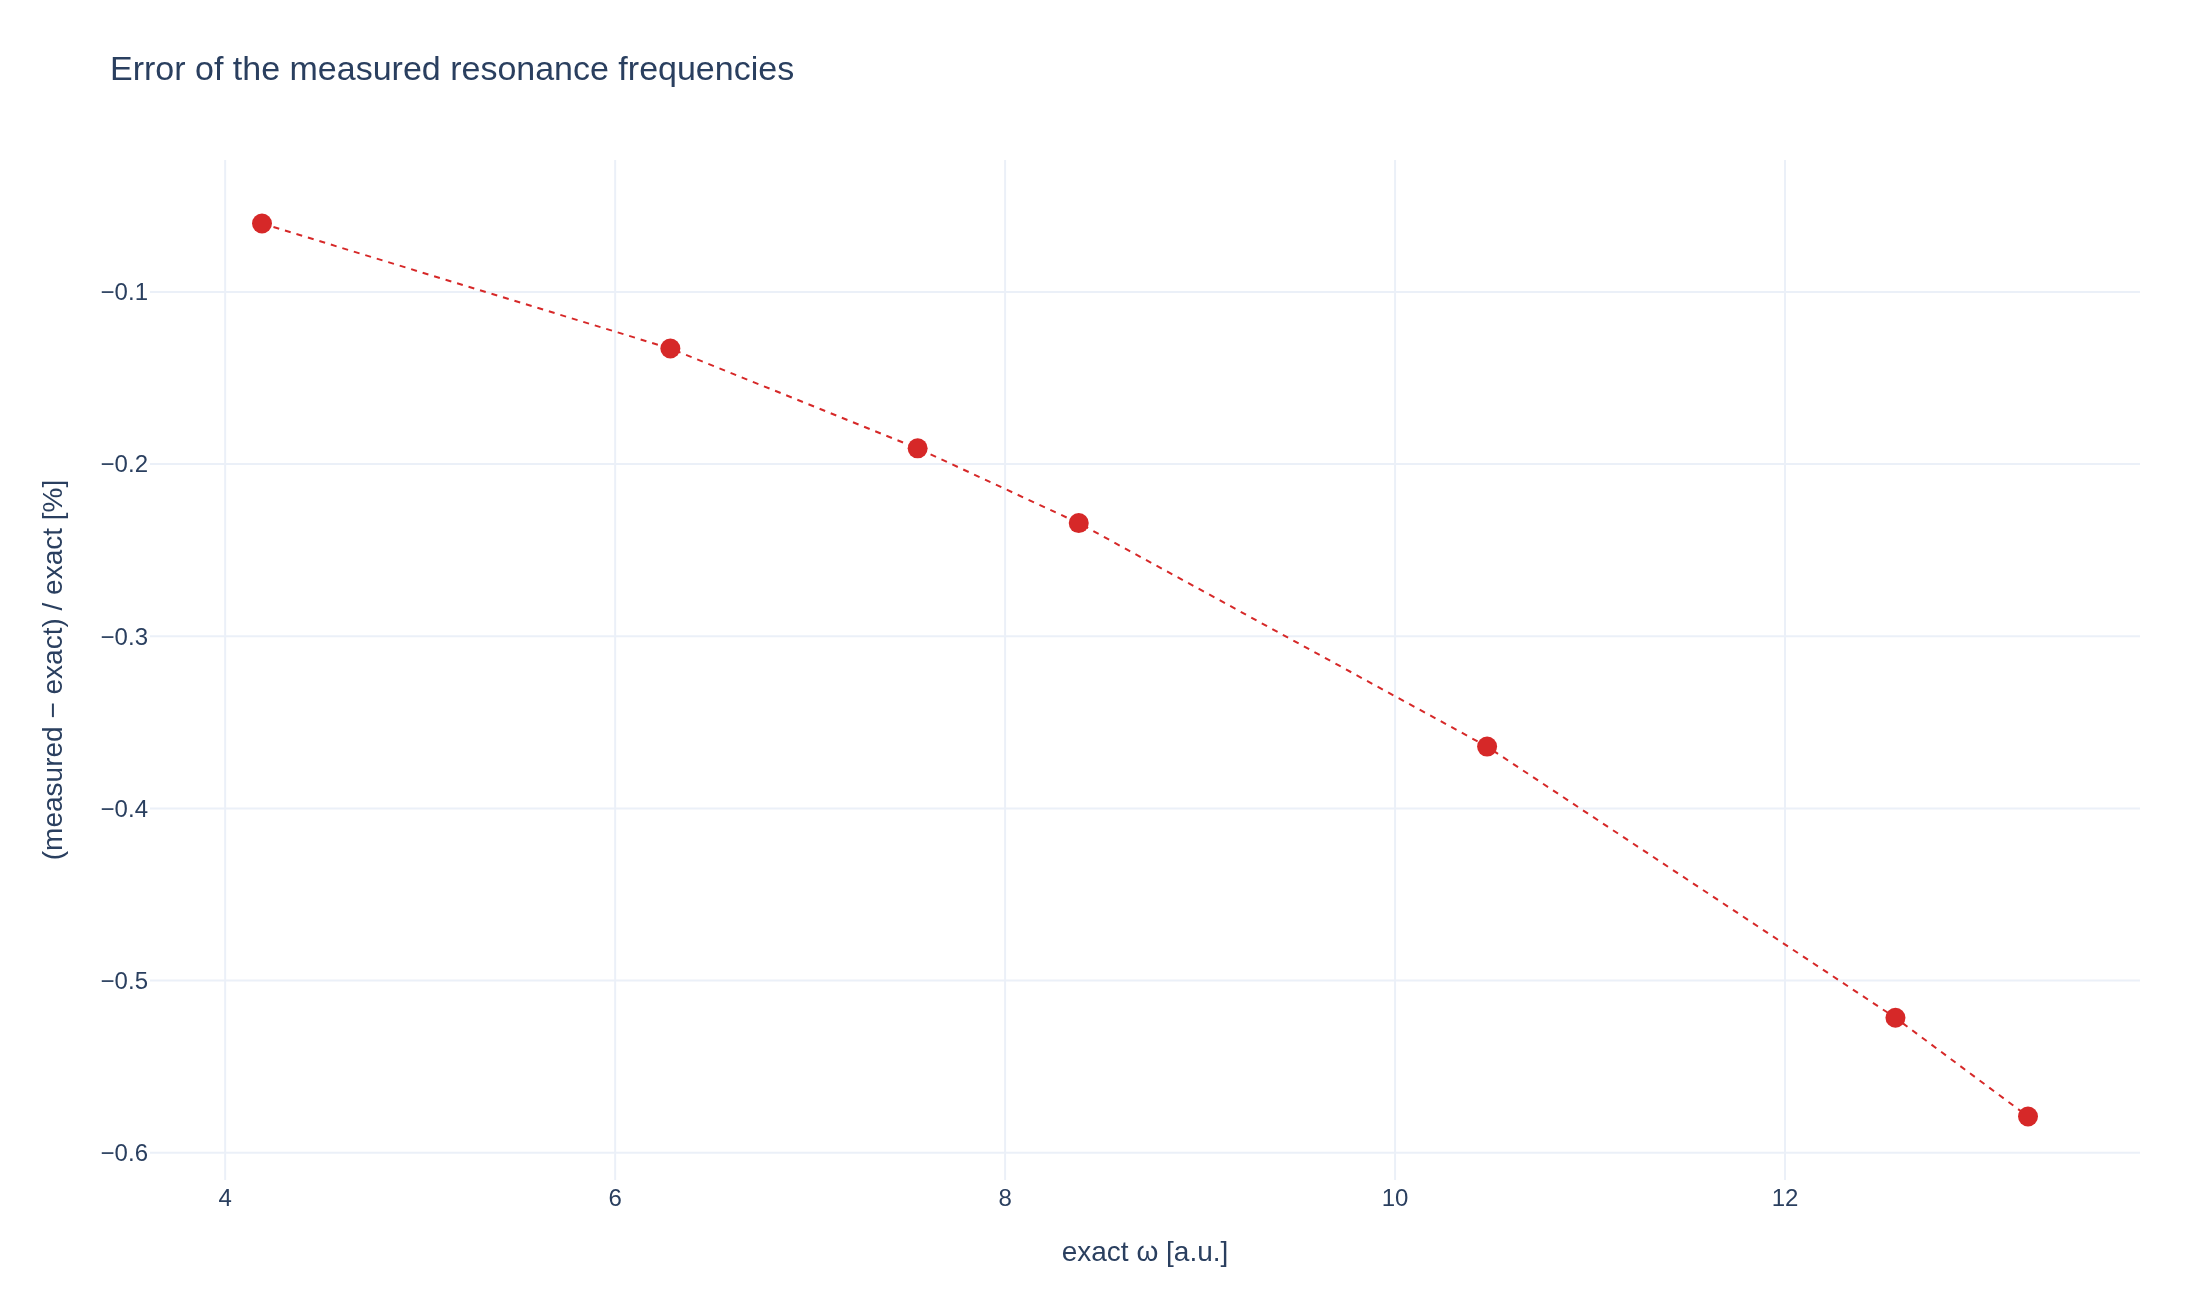
                "The relative difference between each measured peak and the exact resonance frequency, against that "
                "frequency. It is set by the frequency resolution of the run (about 2π/T) and by the numerical dispersion "
                "of the cubic splines, which lowers the higher frequencies."
            ),
        ),
    ]

    merge_metadata(
        "maxwell-cavity-resonances",
        resonances=[{"modes": modes, "exact": omega_exact, "measured": found}
                    for (omega_exact, modes), found in zip(exact, measured)],
        maxRelativeError=float(np.max(np.abs(errors))),
        figures=figures,
        **export_profiling(sim, "maxwell-cavity-resonances"),
    )
See the post-processing guide for more ways to inspect the result.